1. Project Overview
1.1 Background
In Engagement, Ohio, the future is now! For years this sleepy bedroom community was a secret gem in the heart of the state. But now the word is out and the people are running, not walking, to buy up their claim on this bit of paradise!
Anticipating rapid growth, the city of Engagement, Ohio USA is doing a participatory urban planning exercise to understand the current state of the city and identify opportunities for future growth. About 1000 representative residents in this modest-sized city have agreed to provide data using the city’s urban planning app, which records the places they visit, their spending, and their purchases, among other things. From these volunteers, the city will have data to assist with their major community revitalization efforts, including how to allocate a very large city renewal grant they have recently received.
1.2 Motivation
Economic considers the financial health of the city. Over time, are businesses growing or shrinking? How are people changing jobs? Are standards of living improving or declining over time?
In this project, based on VAST Challenge 2022, considering the financial status of Engagement’s businesses and residents, we decide to dig into the economic situation of the Engagement city and use visual analytic techniques to address these questions.
2. Data Source
Datasets were obtained from the VAST Challenge 2022 official website in csv format. Datasets required for this challenge are including, but not limited to:
- Participants.csv
- FinancialJournal.csv
- Pubs.csv
- Restaurants.csv
- CheckinJournal.csv
3. Methodology
The following are the packages required for this challenge, including but not limited to:
tidyverse: are designed to work together to make common data science operations more user friendly. The packages have functions for data wrangling, tidying, reading/writing, parsing, and visualizing, among others.
lubridate: fast and user friendly parsing of date-time data, extraction and updating of components of a date-time (years, months, days, hours, minutes, and seconds), algebraic manipulation on date-time and time-span objects
ggiraph: a tool that allows you to create dynamic ggplot graphs. This allows you to add tooltips, hover effects and JavaScript actions to the graphics. The package also allows the selection of graphical elements when used in shiny applications.
gganimate: extends the grammar of graphics as implemented by ggplot2 to include the description of animation.
ggstatsplot: to provide statistical details
4. Proposed Visualization
4.1 Question 1: Business Situation
- Over the period covered by the dataset, which businesses appear to be more prosperous? Which appear to be struggling?
Visualization 1:
Target
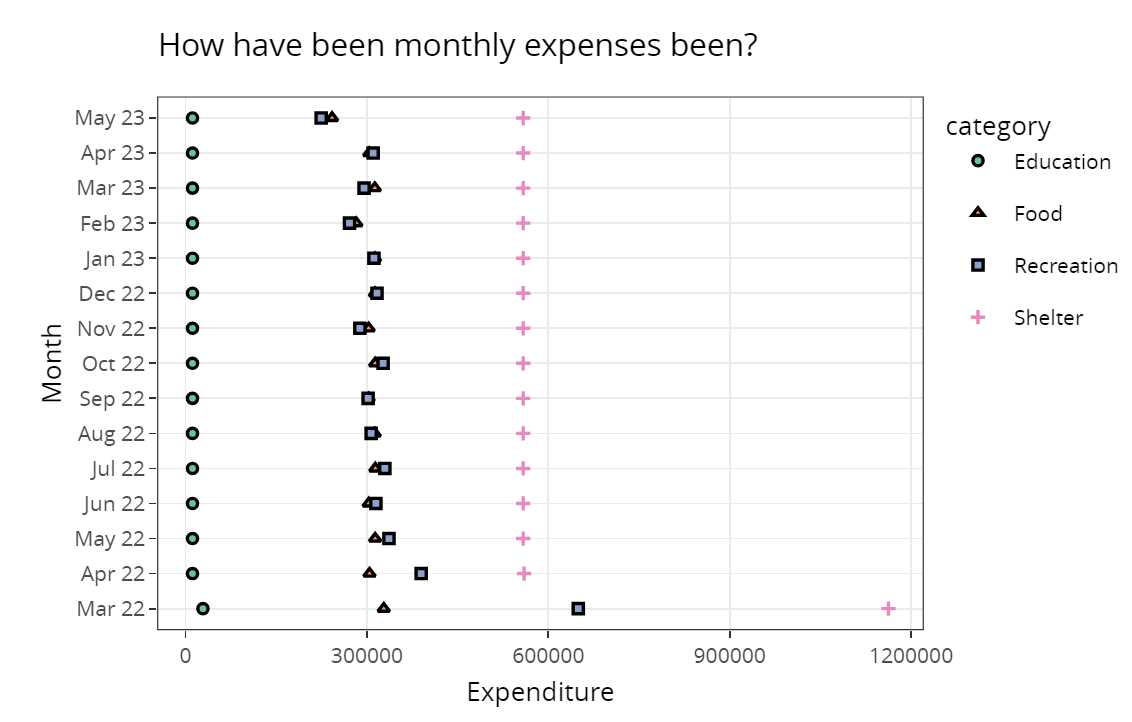
Household consumption can reflect the prosperity of various industries. We can observe the prosperity of various industries through the consumption proportion of residents in all aspects in this research period.
Data
We need to extract residents’ consumption in different aspects from the FinancialJournal.csv, and get the insight by calculating monthly income and expense.
Skeleton
Visualization 2:
Target
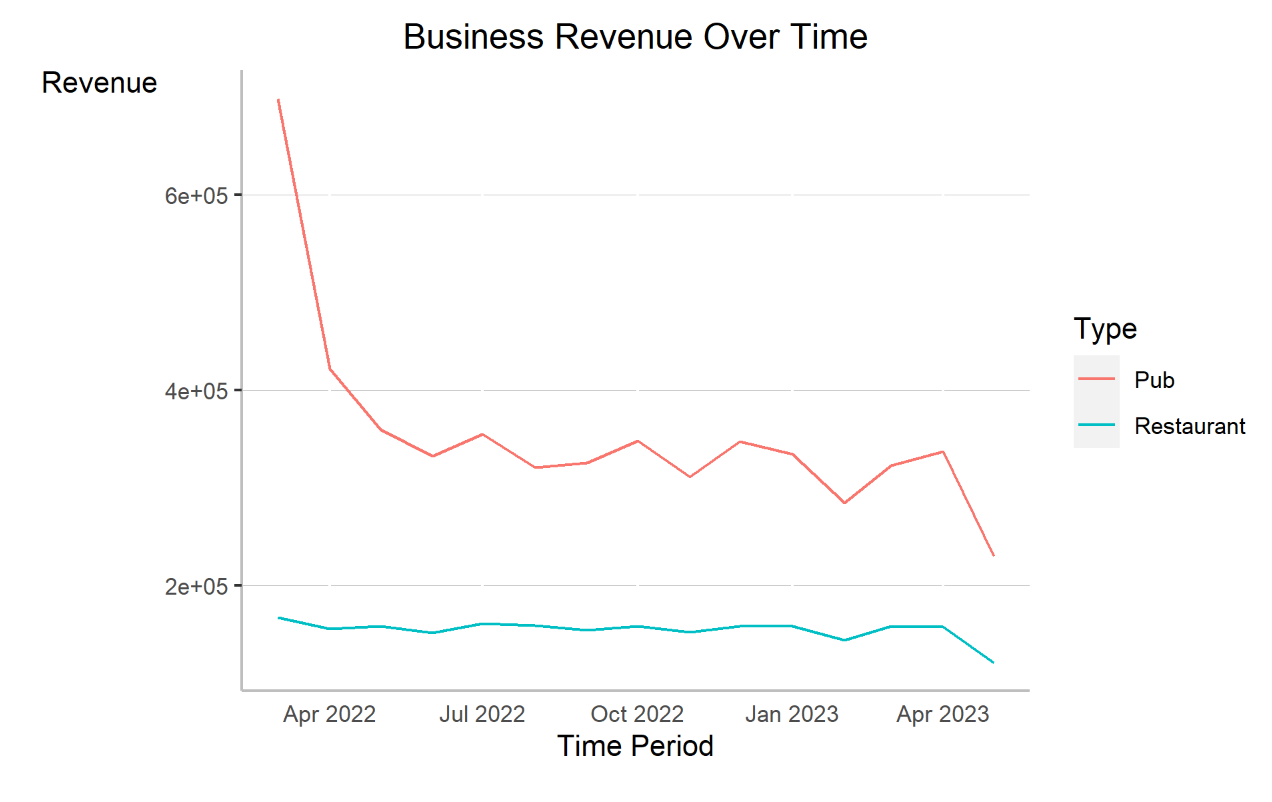
For restaurants and pubs, revenue and number of customers can reflect the prosperity of these two industries.
Data
We need to use TravelJournal.csv to calculate the consumption amount in Restaurant and Pub, and then get the insight of business development situation.
Skeleton
4.2 Question 2: Residents’ Financial Health
- How does the financial health of the residents change over the period covered by the dataset?
- How do wages compare to the overall cost of living in Engagement?
- Are there groups that appear to exhibit similar patterns?
Visualization 1:
Target
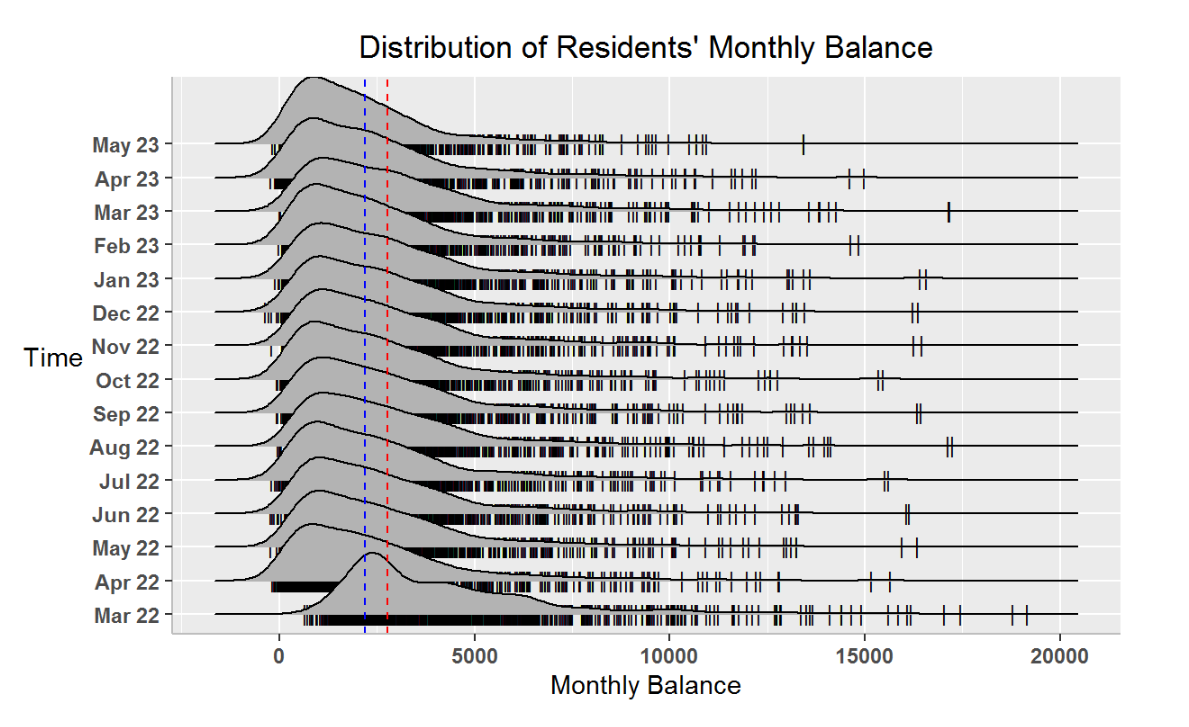
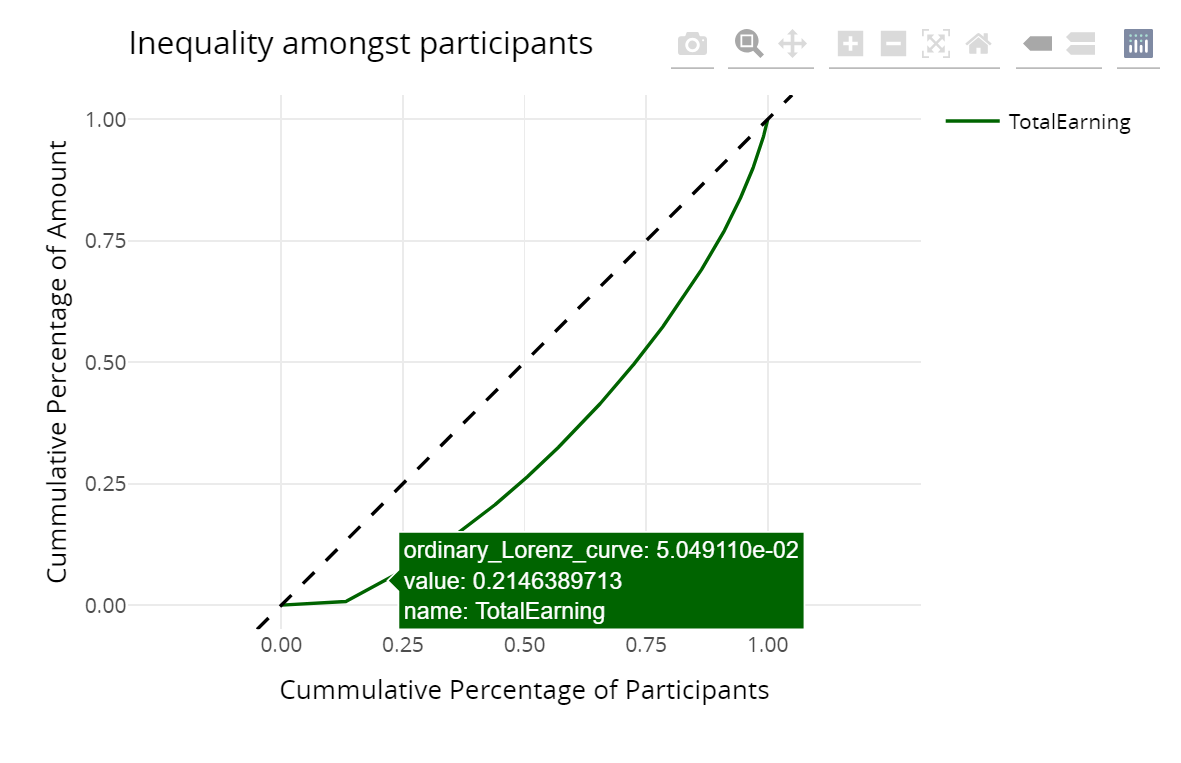
Higher incomes or higher balances mean that people have more money to spend, and a higher consumption on recreation means that people are more likely to enjoy life. So, financial Health can be shown by monthly wage or monthly total/average balance.
To better observe the financial health of this city, lorenz curve also will be used.
Data
We need to use FinancialJournal.csv to calculate the expense, income and balance respectively to visualize the trend during this period.
Skeleton
Visualization 2:
Target
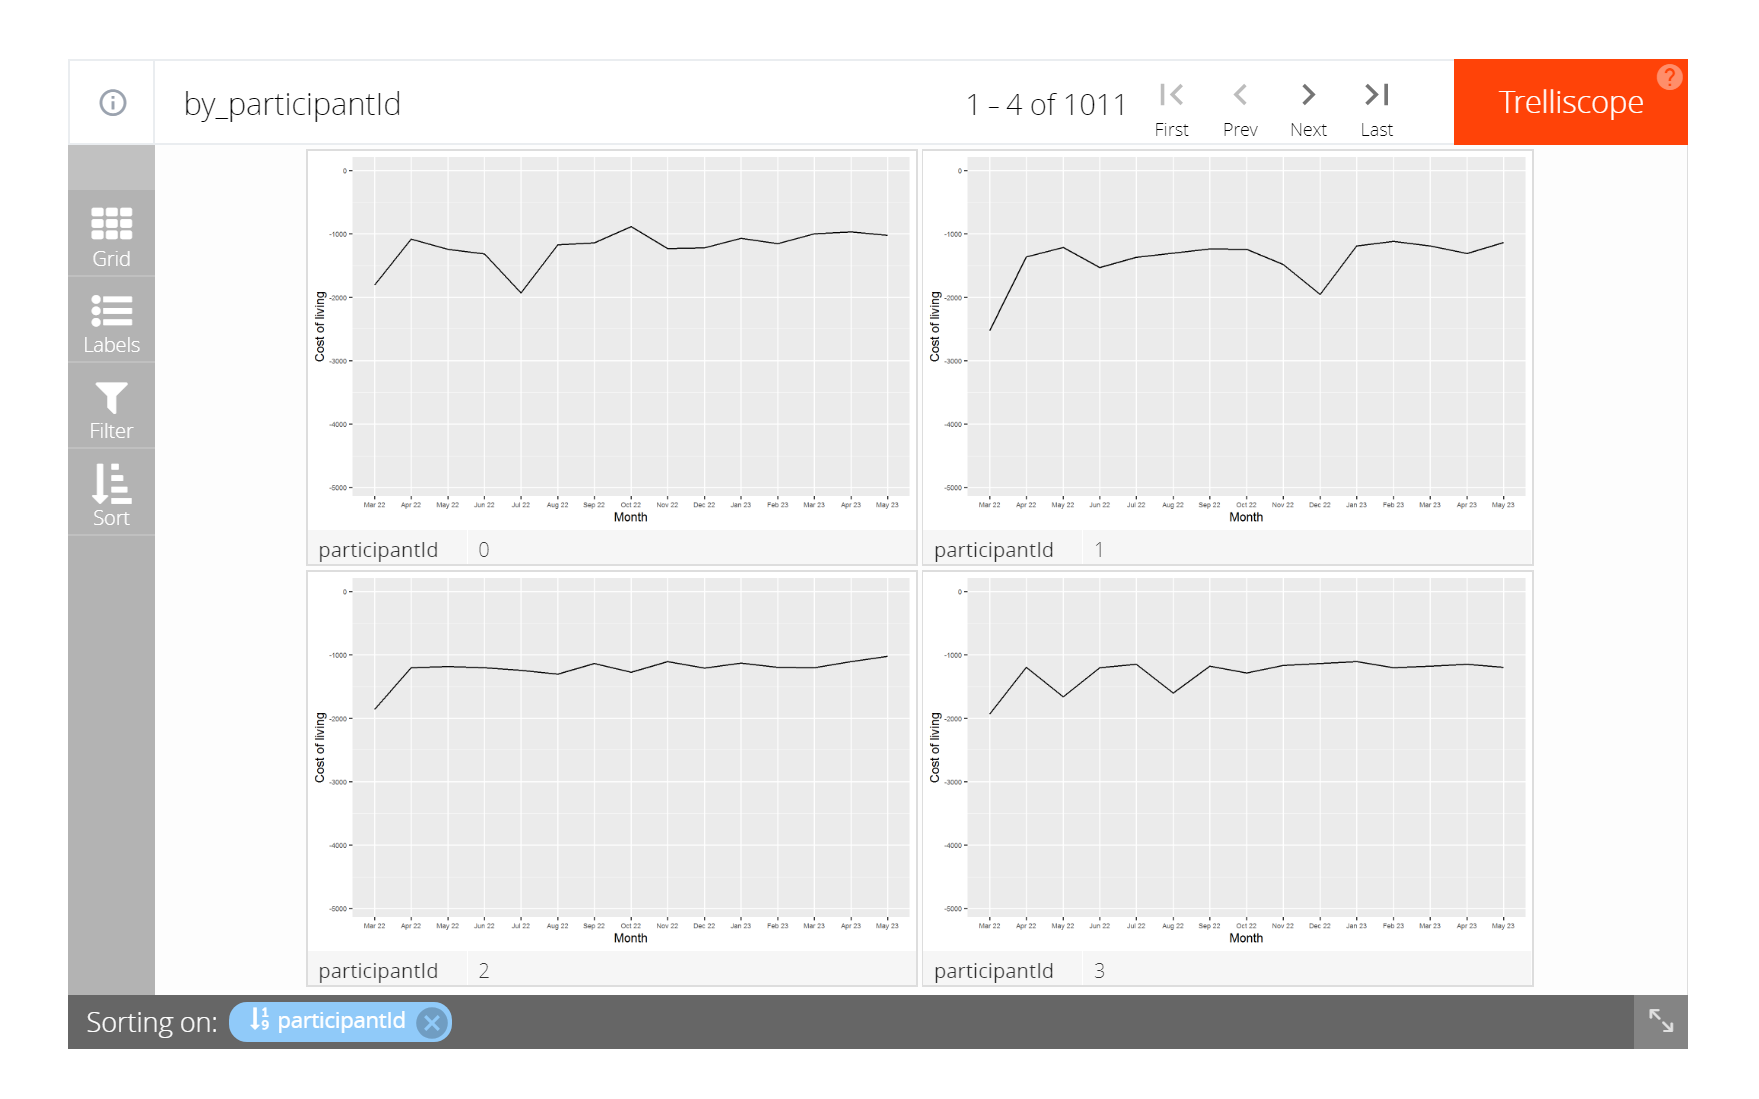
By plotting each individual’s income/expense/balance, we can better evaluate each residents’ financial health.
Data
Original FinancialJournal.csv with participant ID will be used, similarly, to calculate the expense, income and balance respectivelyfor each candidates.
Skeleton
Visualization 3:
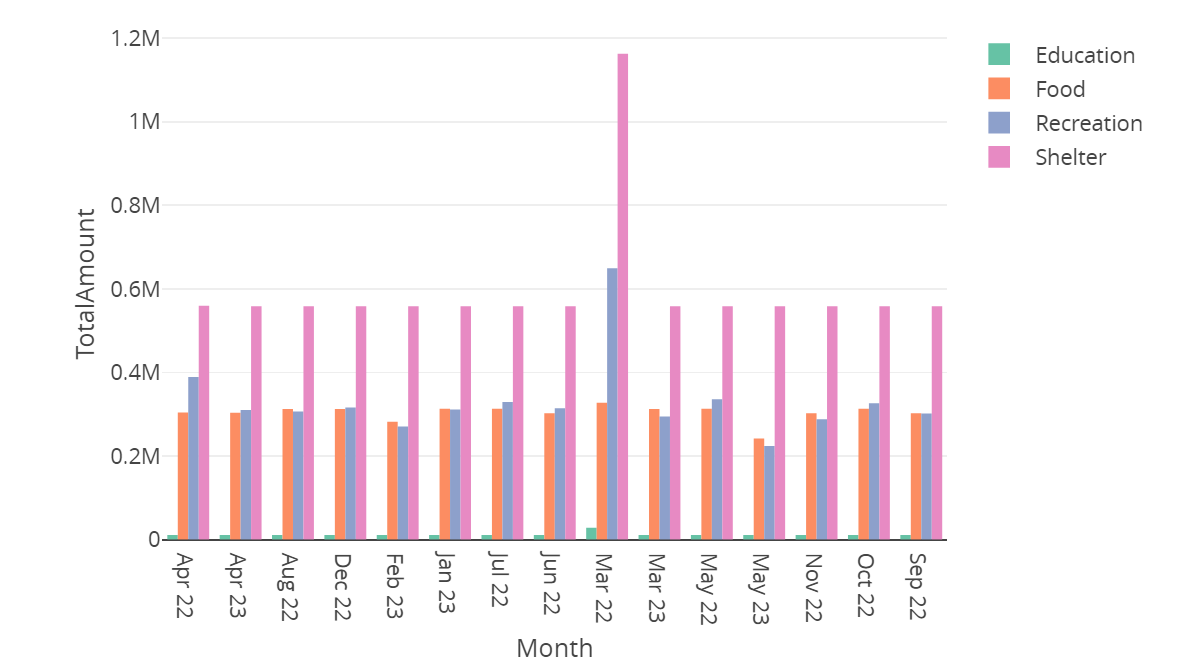
Purpose
How is the expense distributed during this period? Is expenditure on recreation/food increase? Expenditure is another way to understand the financial health and people’s living standard .
Data
Expenditure indifferent aspect need to be filtered out to show the financial situation.
Skeleton
Visualization 4:
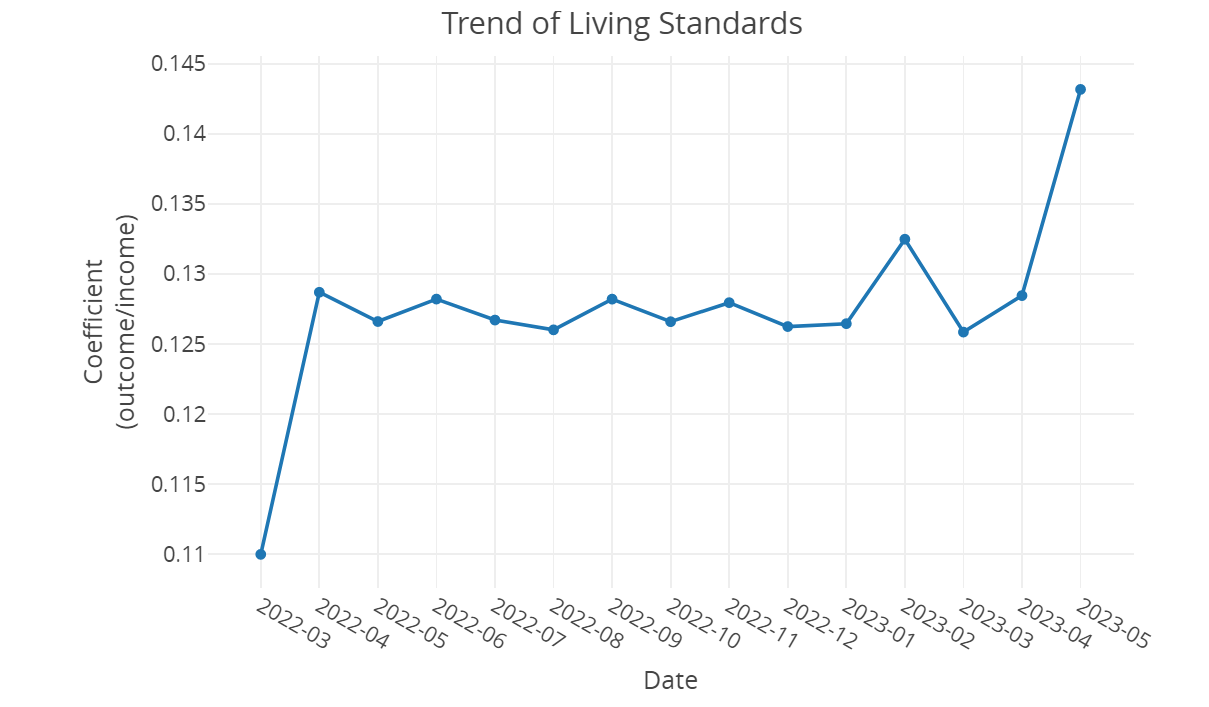
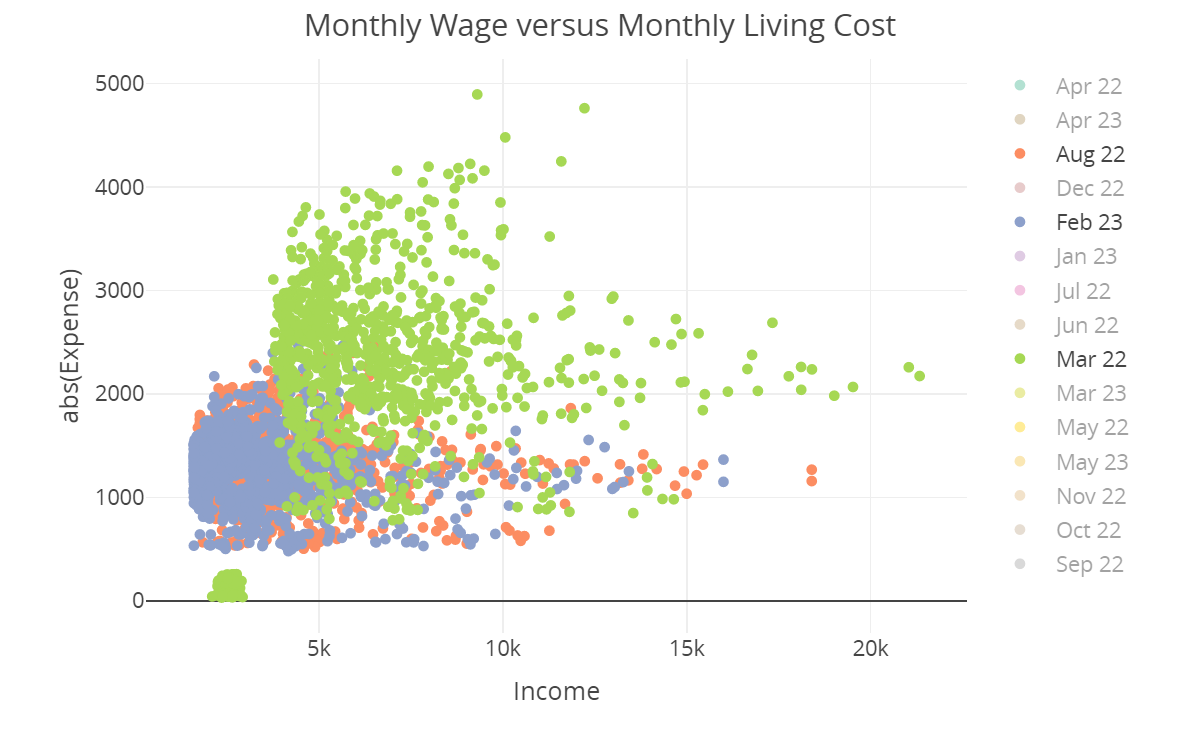
Purpose
How do wages compare to the overall cost of living in Engagement? One way to compare is get the coefficient of expenditure and income, another way is to visualize the scatter plot in each month to observe the distribution of income and expense.
Data
Here, we can calculate the line graph of coefficient- total expense divided by total income.
Skeleton
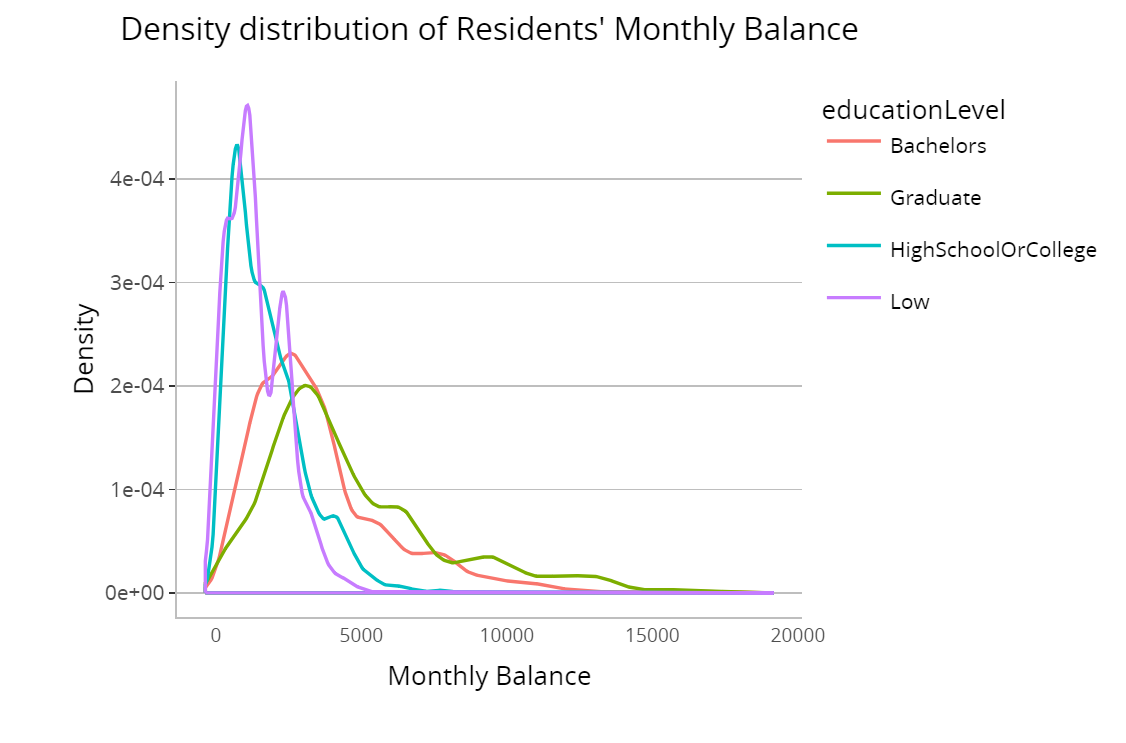
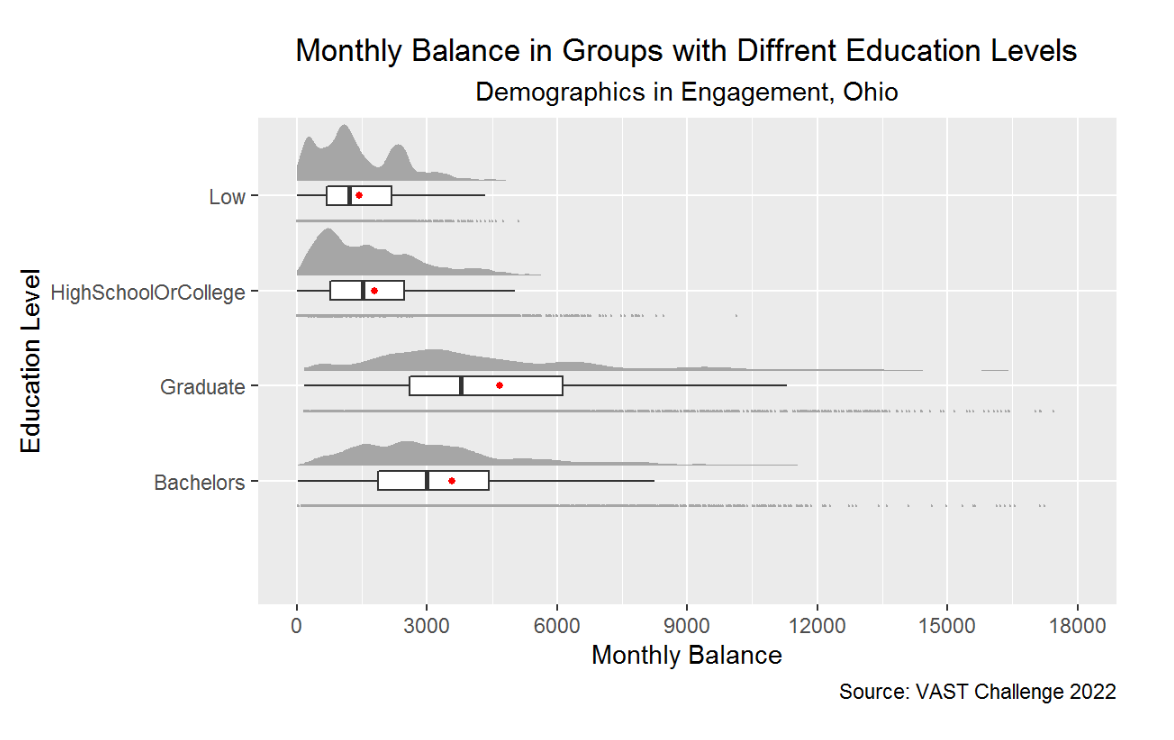
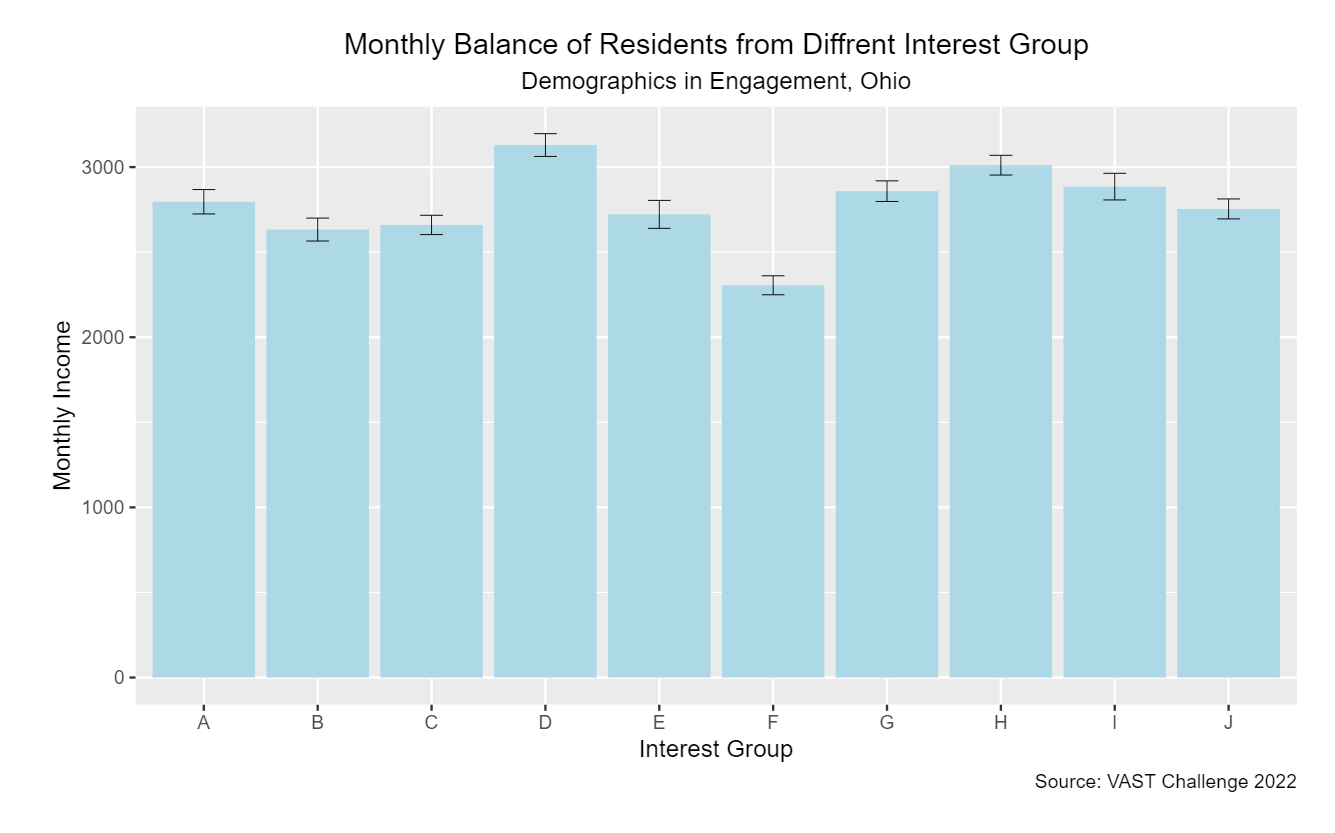
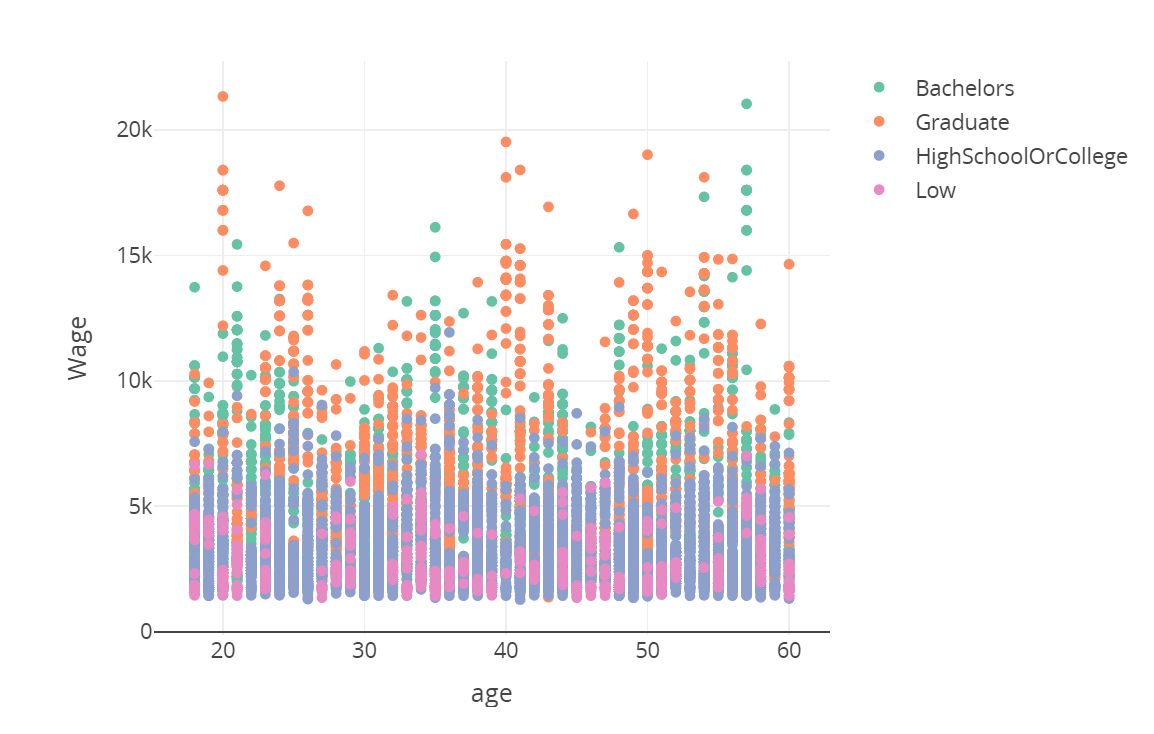
Visualization 5:
Purpose
People’s spend and earning pattern may vary from different interest group, education level , age group and joviality level. There are many graph can help to understand better of these patterns, for example, scatter plot to show the distribution of residents’ expense and income in different age. We need to try multiple tables to see which one can give us a better result.
Data
In addition to participants.csv, Participant.csv also need to be combined to look into financial patterns.
Skeleton
4.3 Question 3: Employer/ Employement Situation
Describe the health of the various employers within the city limits.
What employment patterns do you observe?
Any areas of particularly high or low turnover?
Visulization 1:
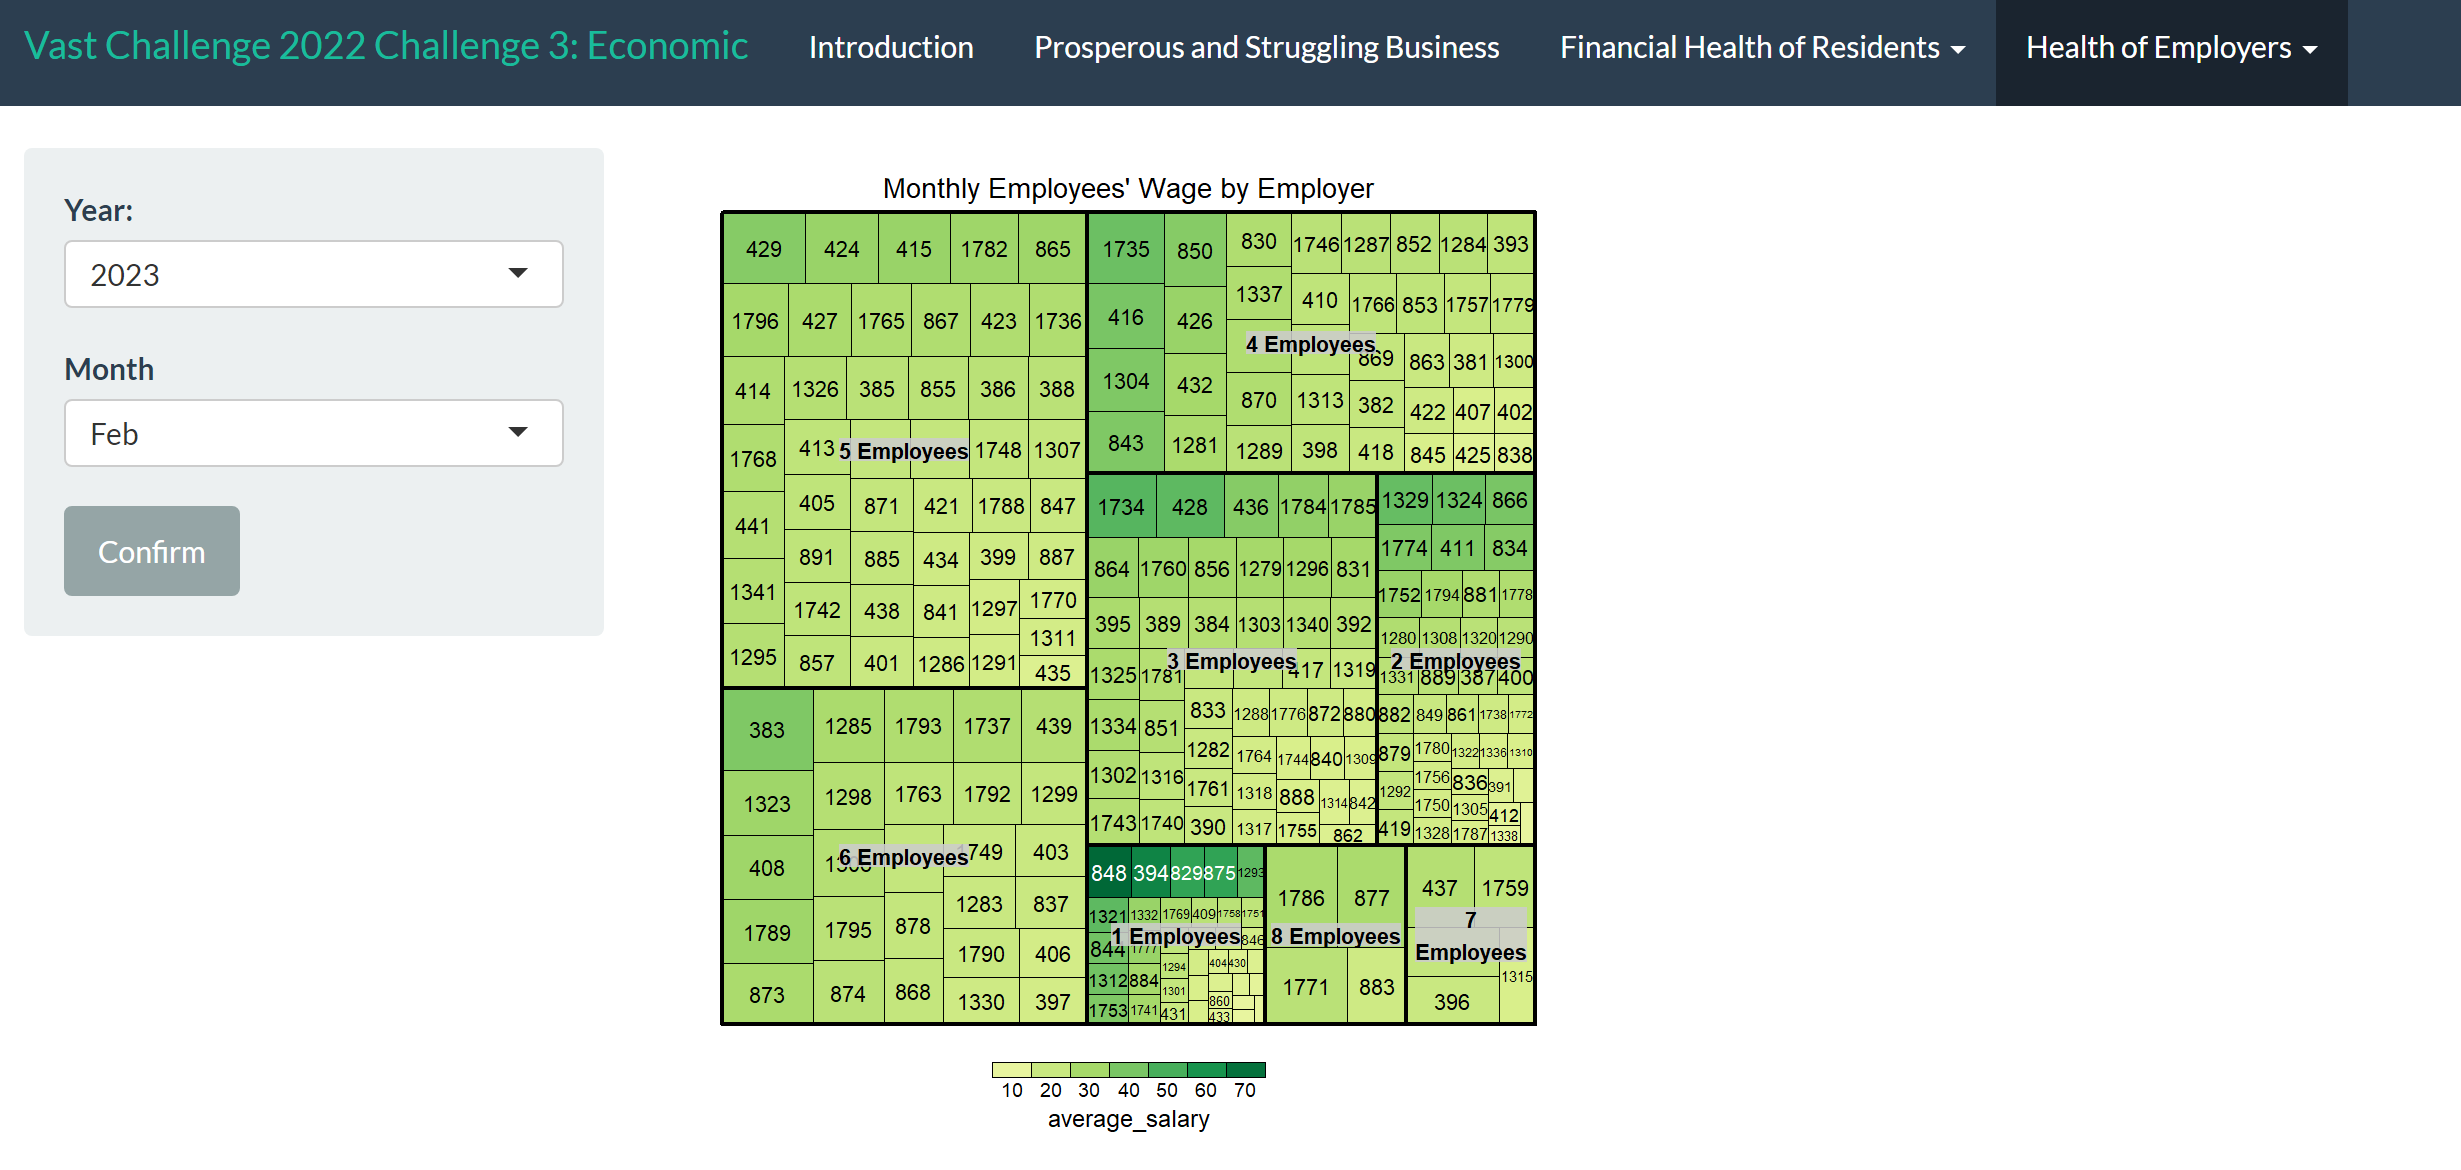
Purpose
To know the health of the various employers, we need to know different employers’ employee size, which can be represented by the shape in tree map; we need to know the salary level of each employer, which can be represented by the shade of the tree map.
The larger the size, the more employer have the same size of employees; the darker the shade, the higher the hourly salary.
Data
We will use ActivityLogs.csv to identify job category, and then join with job.csv by job Id to get the hourly salary that represented by the shade. The joined dataset need to join with Employer.csv to acquire the number of employees that represented by the shape.
Skeleton
Visulization 2:
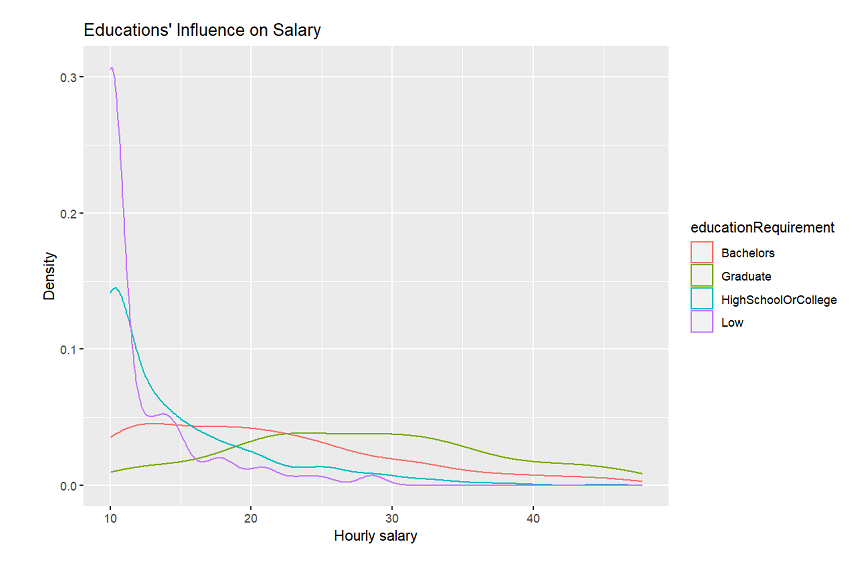
Purpose
Different requirement of education level may implies different salary, it’s one aspect of the employment pattern.
Data
To observe the employment pattern regarding requirement to employees’ education level, Job.csv is utilised to acquire data of education requirement in different employer.
Skeleton
Visulization 3:
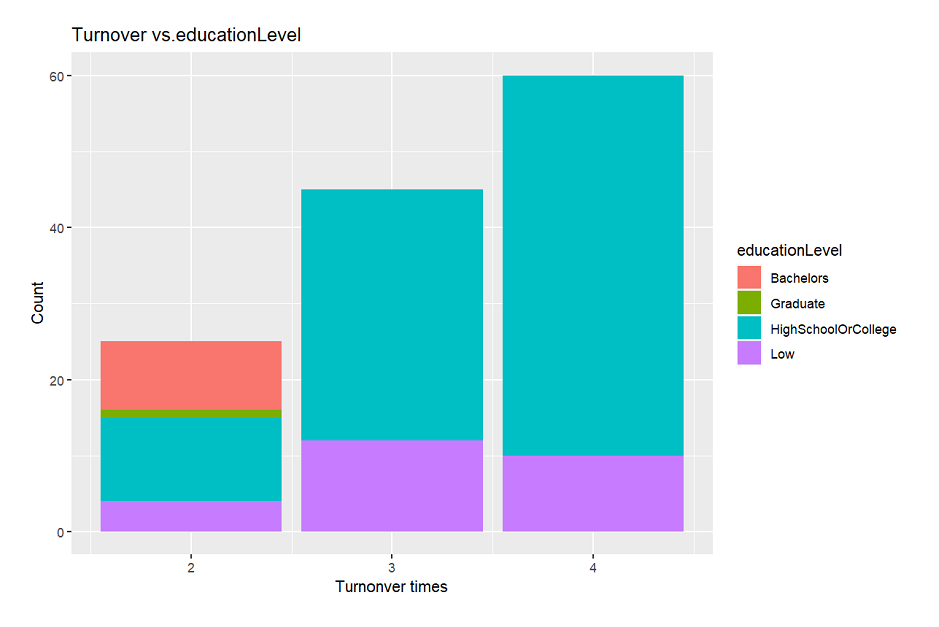
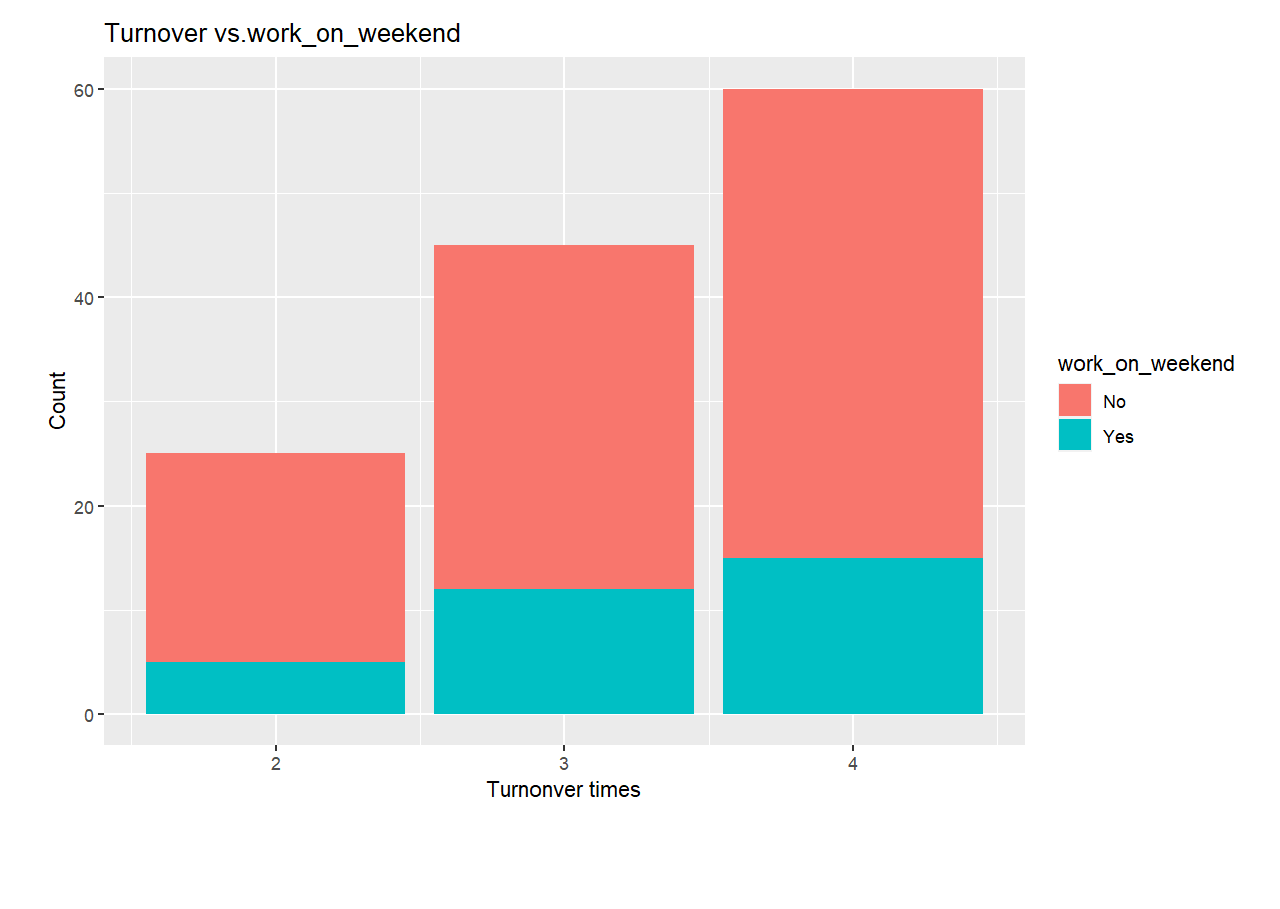
Purpose
Regarding to the areas of particularly high or low turnover, we may explore whether education level requirements affect the turnover rate, whether working days within one week or working frequency in weekends affect the turnover.
Data
First, ActivityLogs.csv is used to calculate the times each one changing a job in this period, then combine with Jobs.csv to show the relationship between the turnover frequency and education level requirement as well as working days in weekends.
Skeleton
5. Application
To have a better interactive visualization experience, please click on App
6. Reference
Chris Muller.(Nov. 29, 2021). https://www.moneyunder30.com/simple-steps-to-evaluating-your-financial-health
J.B. MAVERICK.(February 16,2022). https://www.investopedia.com/articles/investing/061916/what-best-measure-companys-financial-health.asp